Introduction: “Massive Passive” has heavily influenced the equities sector, completely changing the dynamics of the stock market and the make-up of its participants. Now more people are getting exposure to commodities via long-only indexes and swap products. I am taking Irwin and Sanders’s paper The Impact of Index and Swap Funds on Commodity Futures Markets and extending it.
Disclaimer: Not financial advice, only my own opinions. This is not to encourage nor promote taking any trades, positions, or investments of any kind. Any information contained in this website is for informational purposes only and to be taken as is. DWongResearch and the Author (Derek Wong) has done their best to ensure accurate information. Regardless of anything contrary, nothing available on this website should be understood as a recommendation, consult a licensed financial professional in your jurisdiction.
First, I am using more recent data as the Irwin study was done in 2010. I include precious metals that were not included in the original study. Third, I will examine the changes in the return distribution, volatility, and autocorrelation.
The current state of passive commodity funds
Let us examine the current market situation concerning inflows of AUM into passive funds. I will select the iShares S&P GSCI Commodity Index ETF ticker GSG as an example. It is a representative fund and has a long history as well as a well-known index underlying.
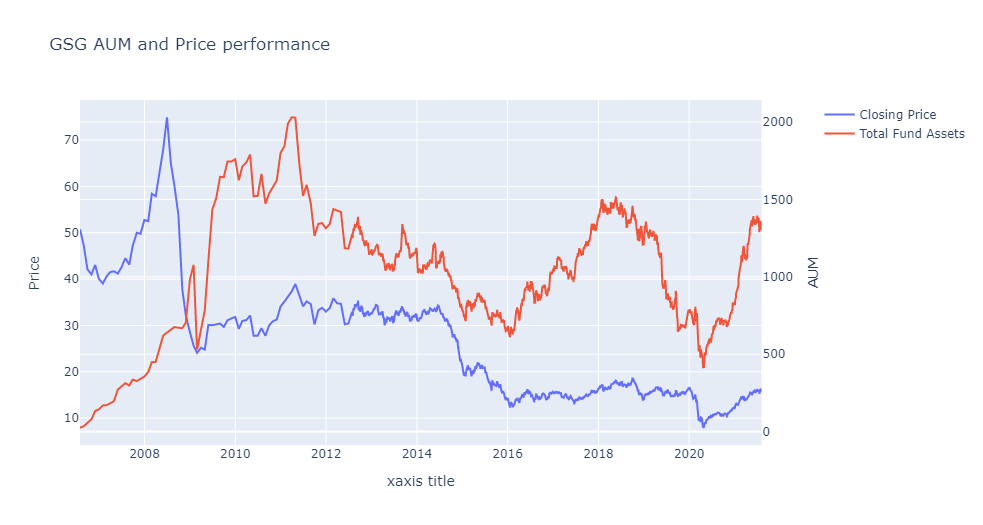
A major difference here we can see is that the Total Fund Assets are cyclical and not monotonic like in large-cap equity indices. This may lead to a different dynamic. Although a slight lead time decrease in TFA seems to lead to downturns, that is just a visual inspection and contains no backing. However, we can see the peak in 2011, and the AUM rose from 2006 until then. The OECD commissioned the original study during that time as AUM was increasing.
This increased participation of index funds and swaps has significantly changed the landscape. I felt that an understanding of their effect and the different levels of TFA was not well understood. Some thinking by analogy to the equities markets could lead us astray. Which in this case, I think it already has as the nature of the TFA is cyclical.
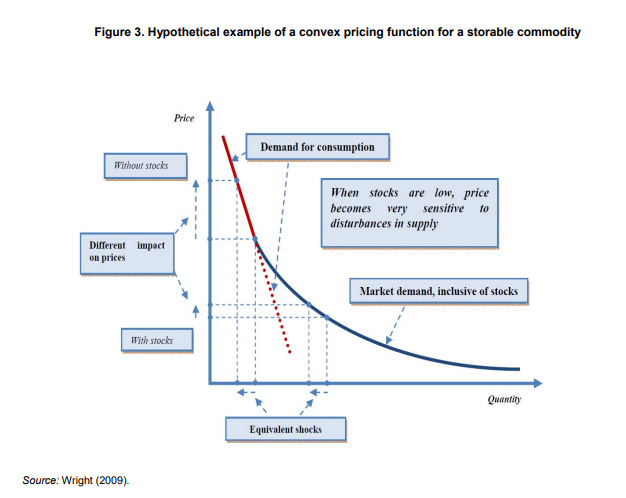
It is also important to note that storable commodities are convex. Here is a graphic from the Irwin et al. paper that describes this. This means that the dynamic heavily influences these index funds, as we saw with Crude oil in 2020.
But I digress.
Data
For the process of this research, I used data from the Disaggregated Commitment of Traders Report on US futures, as they have the most detailed and historically long data set. We start in 06-2006 and end 08-2021 for 791 weekly samples across 14 markets (Rbob Gasoline, Crude oil, Natural Gas, Coffee, Copper, Sugar, Gold, Wheat, Corn, Soymeal, Soybeans, KC Wheat, Cocao, and Feeder Cattle). I use daily data for the futures listed using the front-month contract rolling on a back adjusted basis for the last price.
We infer index or passive investment using information discussed in a CFTC 2008 September report stating that swap dealers’ positions in agricultural markets mirror index trader positions reasonably. This is weaker for energy markets representing only 41% of long swap dealer positions in 2007-2008. However, I include these markets as we have no other way to proxy. There has been no official update on the statistics since then that I could find. Hence we measure the Long Swap positions of all of the futures contracts to measure the index / passive participation in that futures contract.
Measuring the influence of index and swaps on future’s returns
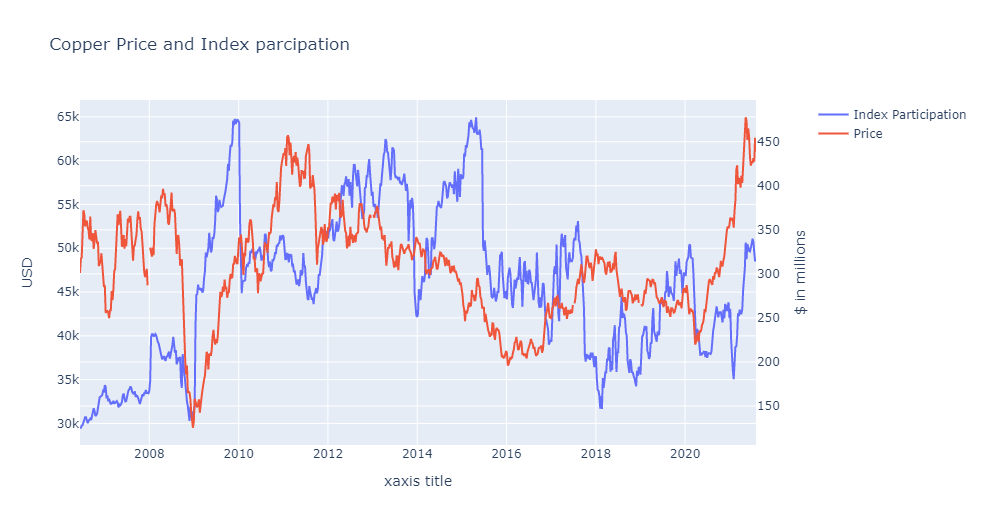
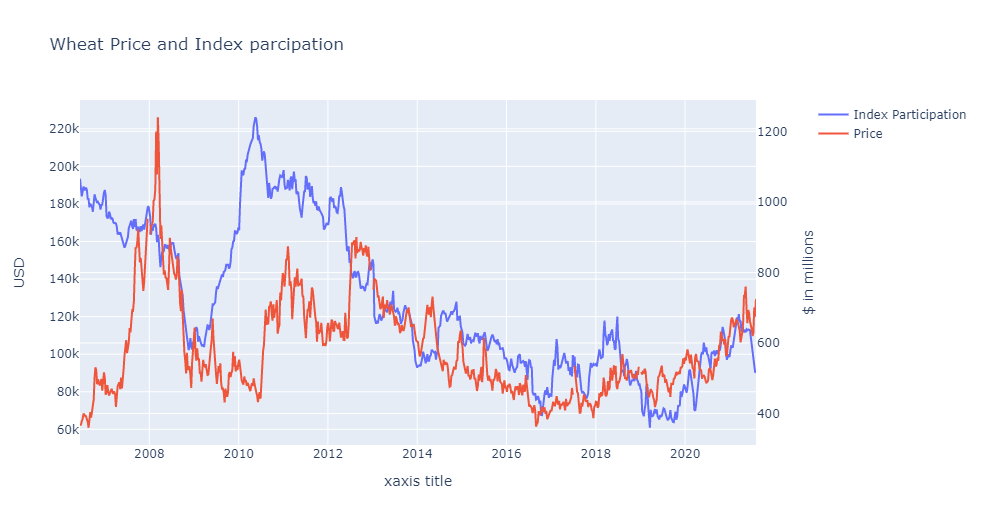
I have selected 3 representative commodities: wheat, crude oil, and copper. We can see that the low amount of participation of indexes in the overall Long Swap(“Index Participation”) leads to a weak if no relationship. While agriculture is represented by wheat which was stated to have a strong relationship in the CTFC statement, however, post-2012, the relationship seems to be high. Copper stands in the middle where it may have some relationship, but it is clear. Bearing out the numbers using correlation coefficient, Wheat is 0.39, Crude Oil -0.06, and Copper at 0.07.

Index participation in relation to returns
I find no evidence that in relation to returns, index participation has any relationship. Let us look at wheat again, but instead of inspecting price, we look at returns.
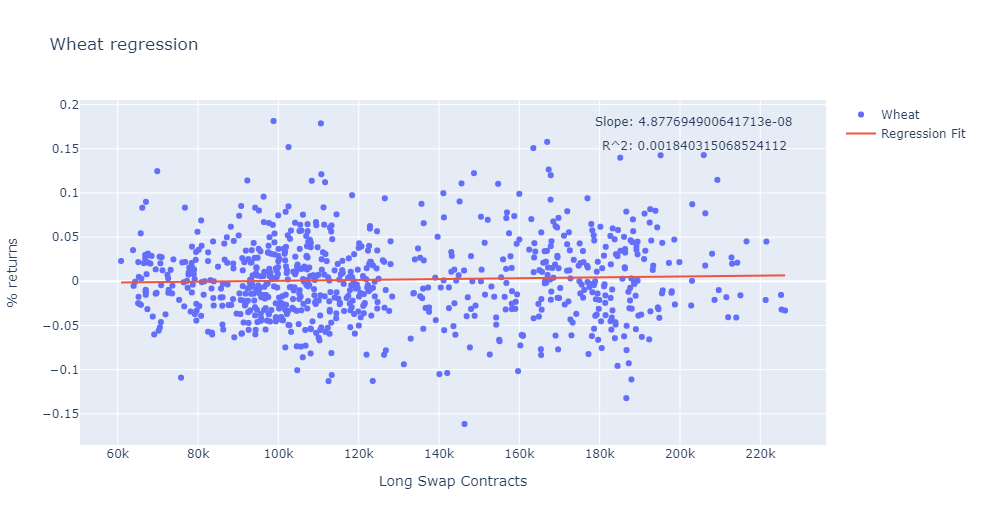
We can see even in one of the most correlated categories on price, in returns space, the result is basically 0 slope and 0 $R^2$. I plot the rest below.
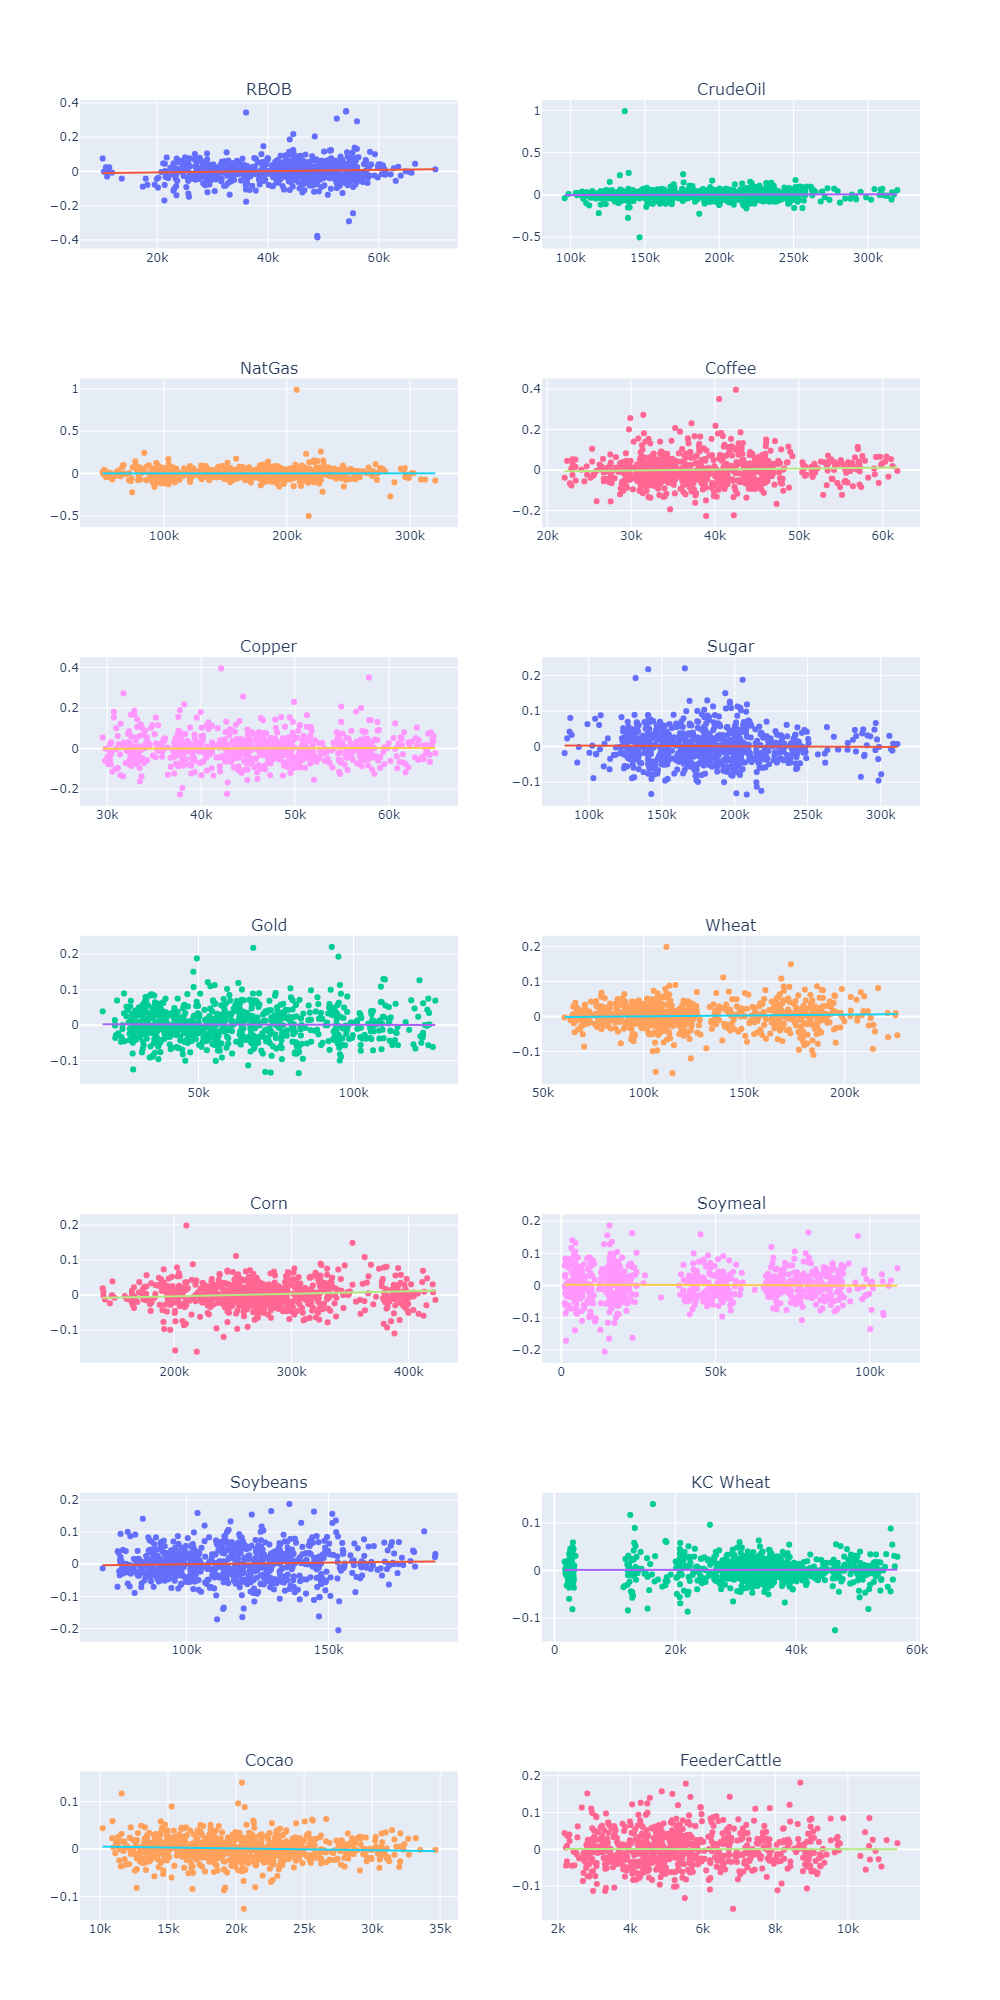
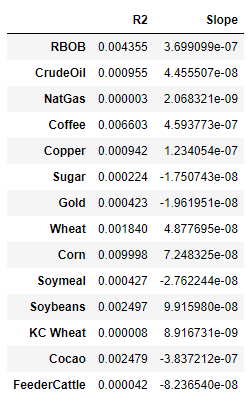
Here is have summarized the $R^2$ and Slope of each of the contemporaneous linear regressions. We can see that there are no significant $R^2$ or Slopes different from 0. From this, I can say that long swaps, a.k.a index participation, do not affect contemporaneous returns for any major commodity future.
Does the level of long swaps affect the return distribution or volatility?
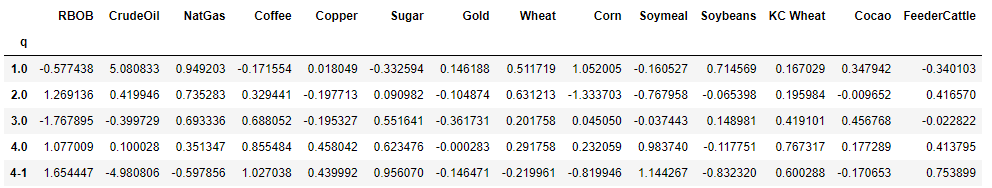
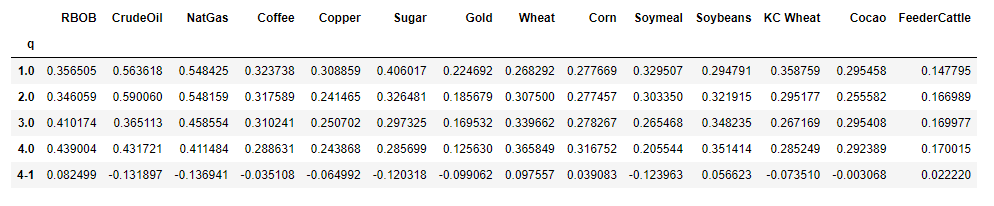
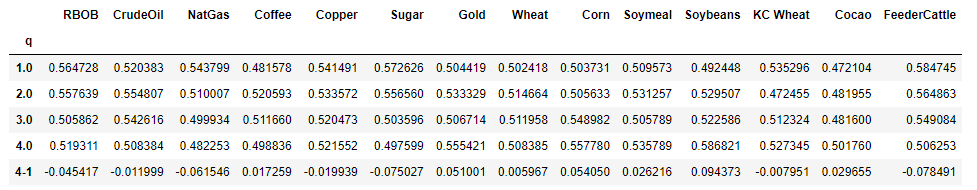
Here I create quartiles (divide the data into 4ths with the lowest being 1 and the highest being 4) in relation to the long swap positions. I then analyze the percent returns for each quartile and then do a quartile spread(4th quartile - 1st quartile). This helps determine any significant changes in the returns distribution based on how much or how little index participation there is. I will go through each of the measures and add my thoughts.
Skew
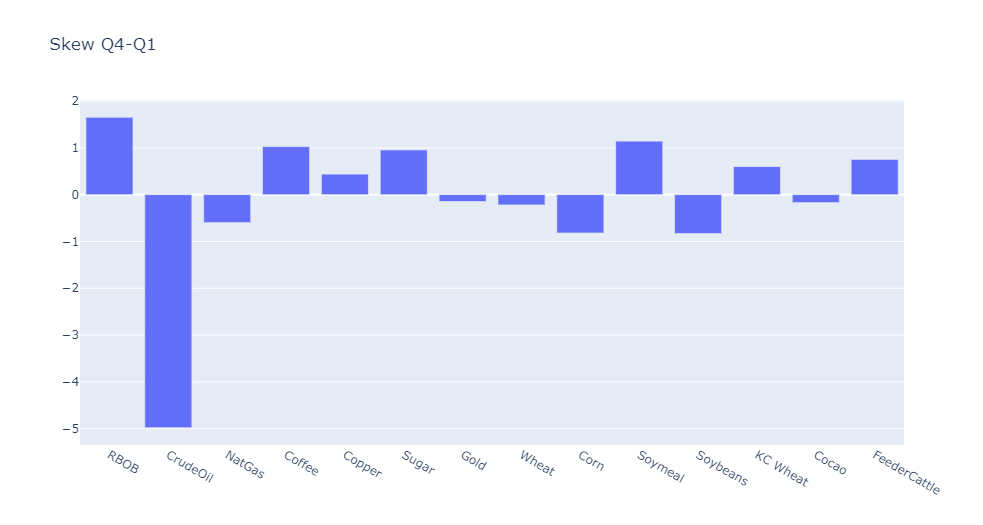
The difference between RBOB gasoline and Crude oil is what stands out to me. One increases negative skewness while the other positive. I do not have an economical answer for that. It could just be an interesting anomaly. I would say it is just noise.
Kurtosis
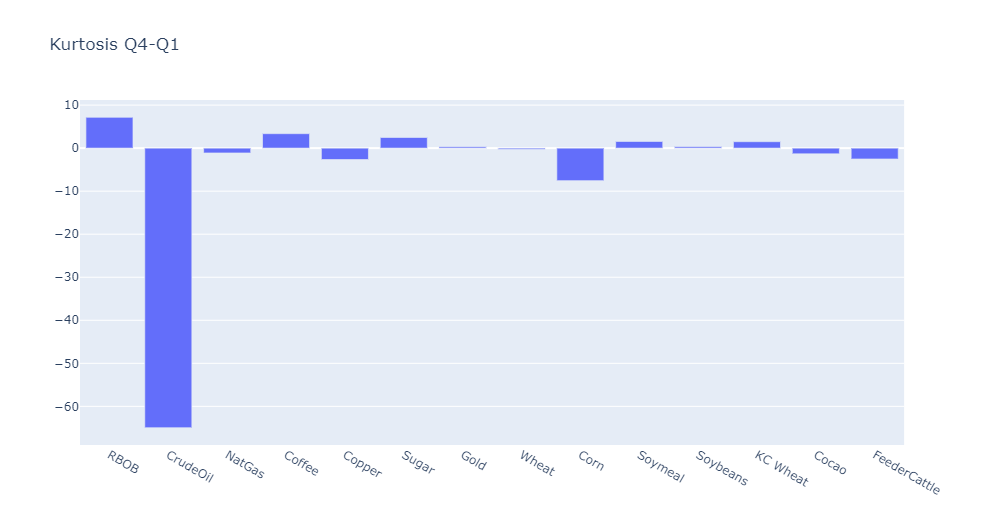
Crude oil stands out again with a Q1 kurtosis of 64 and then dropping slightly negative in Q4. Also, again, RBOB does exactly the opposite, starting at 0 in Q1 then becoming very leptokurtic at 7.7. Another almost 0 result is in Cocao, with kurtosis of 0.01 in the fourth quartile. A majority of the distributions are becoming more leptokurtic, which implies that this action affects the distribution’s tails, although most of the underlying distributions were already positive.
Mean % Returns
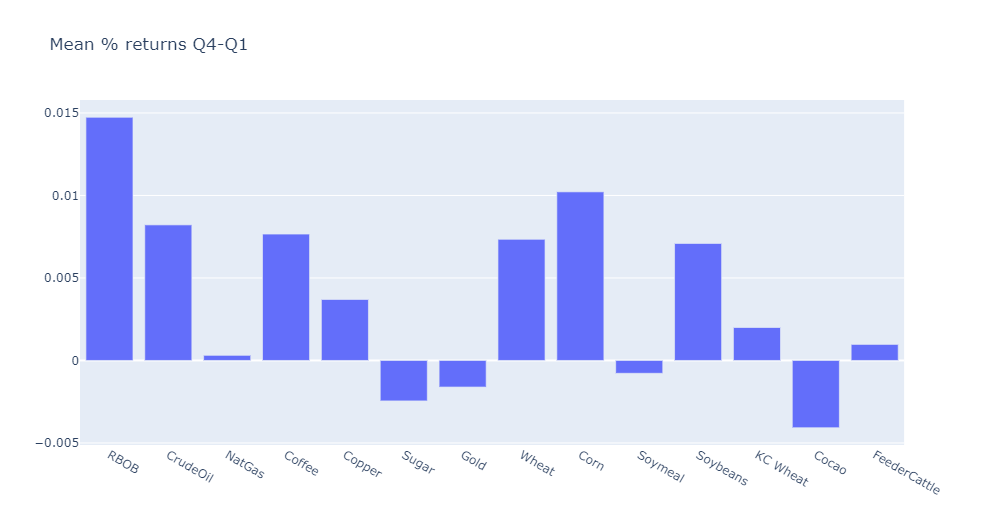
This chart is finally one that is telling. With a vast majority of the positive results and some with results at or above 1%, while the worse performer is Cocao at -0.40%. With participation from all sectors and the magnitude being significantly positive. Index participation in commodities is adding a positive drift component that increases as more participation comes in.
Annualized Volatility
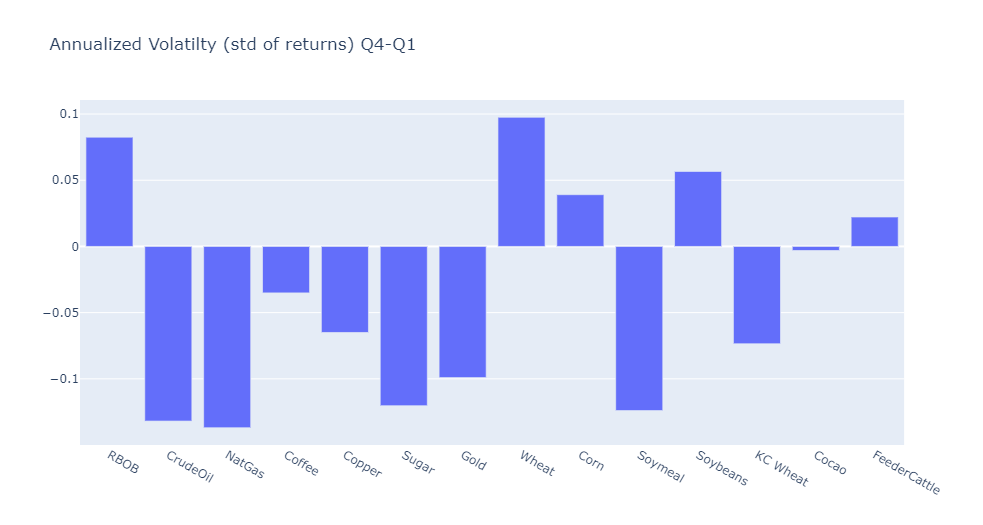
Similar to the returns chart, a majority of these are negative with larger downside magnitudes. This shows that index participation generally reduces annualized volatility by 10% and sometimes more.
Hurst Exponent

This statistic bears a bit of explanation. The Hurst exponent is used to measure the long-term memory of a time series. Simply put, it is a measure of autocorrelation. It quantifies if a time series tends to revert to the mean or cluster in a single direction. Suppose the value is < 0.50 it is ‘mean-reverting,’ and >0.50. It is persistent or ‘trending’ with 0.50 being a perfect random walk. The Hurst exponent is not without its issues and does not perfectly measure mean reversion/trending, but it is a good measurement for our purposes. Here we measure the value with a lookback of 100 days.
Back to the findings. For most of the quartiles, most of the commodities spend their time above 0.50, which means they are persistent or ‘trending’ most of the time. The agriculture complex benefits significantly for additional ‘trending’ from index participation, while the energies and metals suffer.
Conclusion
We have explored the effect of passive investing and index funds on US commodity futures. We have found that, specifically in effect on returns, there is no relationship with negligible correlations with the price to long swap field in the disaggregated COT report. In the passive flows affect the return distribution, the findings for its changing skewness or kurtosis were weak at best except for crude oil. However, the energy complex does have the least relationship with the long swap inventory, which could be another 3rd factor we are not seeing.
We did see a significant influence in a few key areas. First and intuitively, we see positive mean returns with increasing passive fund flows. Since most of the funds and ETFs are long-only, it makes sense they are bidding up the price of the underlying they need to hold to replicate the basket of index returns. Second, in most of the commodities, increased index participation leads to lower volatilities. This also can be traced back to the intuitive sense of long-only funds and their clients. Most will hold for long periods (potentially weeks to months), while our measurement period is a week. This adds significant liquidity to the market, slowing down high turnover gyrations, acting almost as a commercial in the commodities. Their direction is known, and they will always have a position. The question is just how much, which does not change drastically in short periods but slowly over time. Finally, most commodities are above 0.50 Hurst exponent and persistent. Agriculture commodities benefit from additional index participation as it increases their persistence.
cover image: Photo by Mark Stebnicki from Pexels